
Careers

What Are the Top Nitric Acid Suppliers Worldwide?

Choosing a reliable nitric acid supplier requires more than comparing prices or production volumes. Buyers must examine quality systems, delivery capability, safety records, and regional support. This guide introduces leading nitric acid suppliers worldwide and explains the factors behind their market positions.

A dependable supplier should provide consistent concentration, clear batch documentation, and traceable testing results. Look for recognized certifications, trained personnel, and secure transport procedures. A delayed tanker can interrupt fertilizer, metal treatment, or chemical manufacturing operations. Small details matter. Packaging condition, emergency communication, and storage guidance also reveal operational maturity. Local availability may reduce transit risks and simplify technical support. However, global scale does not automatically guarantee better service. Some large producers may offer limited flexibility for smaller customers. Others may have strong regional networks but less transparent sustainability reporting.

This overview uses practical procurement considerations rather than promotional claims. It considers production capacity, product quality, geographic reach, customer support, and responsible environmental practices. Public information can change, and supplier performance may differ by location. That limitation deserves attention. Buyers should confirm current certifications, legal requirements, lead times, and contract terms directly with each company. Independent audits and recent references can strengthen the evaluation. The safest choice is rarely the cheapest quotation. It is the supplier that combines dependable quality, compliant handling, realistic communication, and long-term accountability.
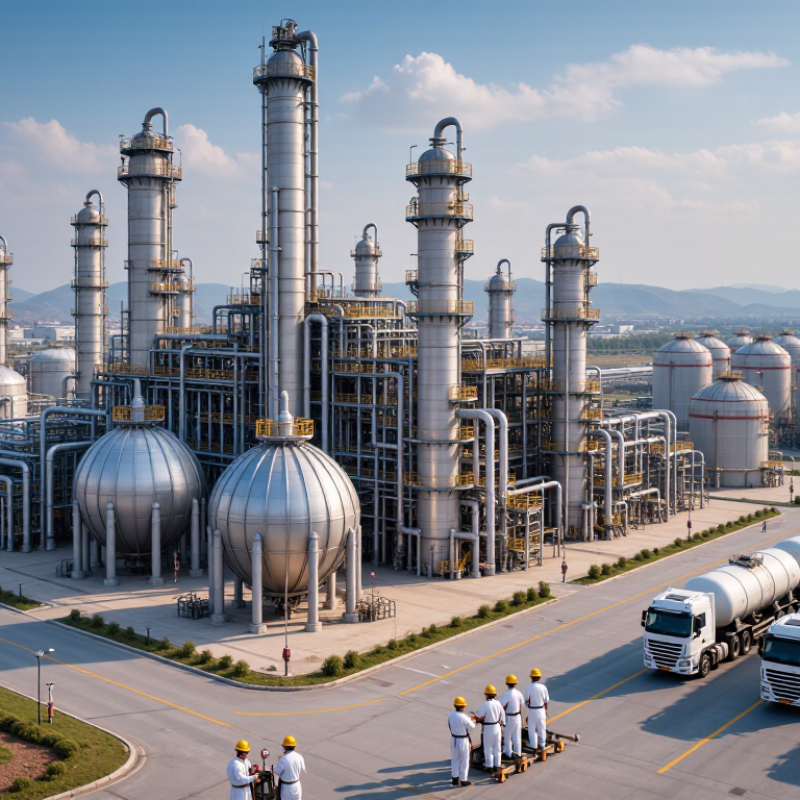
What Are the Top Nitric Acid Suppliers Worldwide?

Nitric Acid: Definition, Uses, and Industrial Importance

What Are the Top Nitric Acid Suppliers Worldwide?

Nitric acid is a clear, highly corrosive liquid made mainly by oxidizing ammonia. Industrial plants often produce commercial grades between 55% and 68% concentration. Its largest use is ammonium nitrate production for fertilizers. It also supports metal treatment, chemical manufacturing, and selected polymer processes. These applications demand strict process control, reliable storage, and trained handling teams.

The International Fertilizer Association reported global fertilizer demand near 192 million tonnes of nutrients in 2023/24. This figure shows why nitric acid remains strategically important, even when market reports measure fertilizer output instead. The U.S. Geological Survey has also reported global ammonia production above 150 million tonnes annually. Ammonia availability strongly influences nitric acid supply. Leading suppliers usually operate integrated plants near ammonia units, rail terminals, ports, or fertilizer complexes. Yet capacity alone is not enough. Emission controls, concentration consistency, delivery reliability, and emergency planning deserve equal attention. Some reports blur nitric acid capacity with downstream product capacity. That comparison can mislead buyers.

Tips: Verify concentration, impurity limits, packaging, and transport procedures before purchasing. Request recent certificates of analysis and plant safety records. Compare delivered cost, not only the quoted chemical price. A cheaper offer may conceal weaker logistics or higher compliance risks. Always confirm local storage requirements with qualified safety personnel.

What Are the Top Nitric Acid Suppliers Worldwide? - Nitric Acid: Definition, Uses, and Industrial Importance

Nitric acid is commonly supplied in different concentration grades for fertilizer production, metal treatment, explosives manufacturing, chemical synthesis, and laboratory applications. The chart shows representative commercial concentration benchmarks rather than company or brand data.

Commercial nitric acid is often supplied at concentrations between approximately 50% and 68% by mass. Around 68% corresponds to the atmospheric-pressure azeotropic composition, while fuming nitric acid generally contains more than 86% nitric acid.

How to Evaluate the World’s Leading Nitric Acid Suppliers

Evaluating the world’s leading nitric acid suppliers requires more than comparing prices. A reliable supplier should provide consistent concentration, transparent impurity data, and batch-specific certificates of analysis. Ask how samples are tested, calibrated, and retained. Small variations can affect fertilizer production, metal treatment, and laboratory performance. Request technical documents before signing a contract. Clear answers matter.

Experience is visible in practical details. Check production capacity, storage conditions, packaging strength, and delivery performance across different seasons. A serious supplier should explain how it manages corrosion, temperature control, emergency response, and safe transport. Review quality certifications, regulatory records, insurance coverage, and independent audit results. Speak with recent customers when possible. References can reveal delays that brochures hide.

Do not judge suppliers by scale alone. A large facility may still provide slow support or inconsistent communication. A smaller producer may offer stronger technical attention, but limited backup capacity. This comparison is easy to miss. Build a scorecard covering quality, safety, documentation, lead time, continuity planning, and total cost. Verify claims through site visits or third-party inspections. No evaluation is perfect. My own mistake has been trusting polished paperwork without checking operational evidence. Reassess performance after several shipments, because a promising first delivery proves very little.

Top Nitric Acid Suppliers by Region and Production Capacity

Nitric acid suppliers vary sharply by region, plant scale, and access to ammonia feedstock. In Europe, established chemical producers often serve fertilizer, mining, and industrial customers through integrated complexes. Their facilities may support annual output in the hundreds of thousands of tonnes. However, aging infrastructure can affect maintenance schedules and delivery reliability.

Asia-Pacific holds some of the largest production clusters, especially near major fertilizer and chemical hubs. Large sites may exceed one million tonnes of annual capacity across several nitric acid units. North American suppliers commonly combine nitric acid production with ammonium nitrate and specialty chemical operations. Regional capacity is substantial, but transport distances can influence delivered cost. The Middle East benefits from competitive feedstock access and expanding downstream infrastructure. Latin American producers usually operate at smaller or mid-sized scales, with imports filling supply gaps in some markets.

Capacity alone does not identify the best supplier. Buyers should verify concentration, technical grade, storage controls, emergency planning, and documented quality systems. Shipment history matters too. A supplier with lower nominal output may provide more dependable regional service. Production figures also require caution. Public estimates can combine several plants, while temporary shutdowns reduce actual availability. That detail is easy to miss. Experienced procurement teams compare audited capacity, local regulations, lead times, and backup supply routes before signing long-term contracts.

What Are the Top Nitric Acid Suppliers Worldwide? - Top Nitric Acid Suppliers by Region and Production Capacity

Regional overview of industrial nitric acid supply, estimated operating capacity, production structure, and principal end-use markets

Global Rank Region Representative Producing Countries Estimated Annual Capacity
(Million Metric Tonnes)
Estimated Share of Global Capacity Typical Commercial Grades Main Feedstock and Process Key Demand Sectors Supply Position
1 Asia-Pacific China, India, Japan, South Korea, Indonesia and Southeast Asian markets 30–35 Approximately 48–52% 55–68% aqueous nitric acid; selected high-purity grades Ammonia oxidation through the Ostwald process; integrated with nitrogen-fertilizer complexes Ammonium nitrate, calcium ammonium nitrate, industrial explosives, adipic acid, metal treatment and electronics chemicals Largest and fastest-expanding regional base
2 Europe Germany, Poland, France, Belgium, the Netherlands, Spain, Italy and Central European markets 10–12 Approximately 16–18% 55–68% industrial acid; concentrated nitric acid up to about 98% Large-scale ammonia oxidation units, frequently integrated with nitrate and fertilizer production Fertilizers, explosives, pharmaceuticals, polymers, specialty chemicals and metal-processing applications Mature, highly integrated supply network
3 North America United States, Canada and Mexico 8–10 Approximately 13–15% 55–68% industrial acid; concentrated grades for specialty processing Ammonia-based Ostwald process, with production concentrated near fertilizer, mining and chemical corridors Mining explosives, fertilizers, nitration chemistry, polyurethane intermediates and metal finishing Stable domestic supply with regional trade flows
4 Latin America Brazil, Chile, Argentina, Colombia and Peru 4–5 Approximately 6–8% 55–68% industrial acid; limited high-concentration production Ammonia oxidation, commonly located near fertilizer plants, mining regions and major industrial ports Mining explosives, fertilizers, metals processing, chemical intermediates and pulp-related chemicals Mixed domestic production and imports
5 Middle East Saudi Arabia, Qatar, Oman, the United Arab Emirates and Türkiye 3–4 Approximately 5–6% 55–68% industrial acid; selected concentrated grades Gas-based ammonia production linked to integrated nitrate and fertilizer facilities Fertilizers, industrial explosives, mining chemicals and downstream nitrogen products Export-oriented integrated production
6 Africa Egypt, Morocco, South Africa, Algeria and North African industrial corridors 2–3 Approximately 3–5% 55–68% industrial acid; concentrated material available in selected facilities Ammonia oxidation integrated with phosphate, nitrate and fertilizer value chains Fertilizers, mining explosives, phosphate processing and general industrial chemistry Developing capacity with import dependence in several markets
7 Oceania Australia and New Zealand 1–2 Approximately 2–3% 55–68% industrial acid; specialized grades supplied through regional distribution Ammonia oxidation at chemical and explosives complexes, supported by imported product where required Mining explosives, fertilizers, mineral processing and laboratory chemicals Small regional base with strong mining demand

Data note: Capacity figures are indicative 2024 estimates for nitric acid production units and integrated chemical complexes, expressed as million metric tonnes per year. Ranges are used because some facilities report combined nitrate-acid capacity, captive production, or nameplate rather than continuously operating capacity. Global capacity represented by the regional ranges is approximately 58–71 million metric tonnes per year. Actual output varies with ammonia availability, fertilizer operating rates, maintenance schedules, energy costs and environmental regulations.

Product Grades, Manufacturing Technologies, and Service Offerings

The leading nitric acid suppliers compete on grades, process control, and dependable delivery. The International Fertilizer Association’s Medium-Term Fertilizer Outlook 2024–2028 places global nitrogen fertilizer demand above 110 million tonnes of nutrient annually. That demand supports large volumes of weak nitric acid, commonly around 55–68% concentration, for nitrate fertilizer production. Concentrated grades, often near 98%, serve specialty chemical and industrial applications. Buyers should verify concentration, trace metals, color, packaging, and certificate accuracy rather than trust a simple grade label.

Most large plants use the Ostwald process, converting ammonia through platinum-rhodium catalyst gauze. Modern systems recover reaction heat to generate steam and reduce energy losses. The European Commission’s Best Available Techniques reference document for large-volume inorganic chemicals highlights heat recovery, absorption efficiency, and nitrogen-oxide control as key performance areas. The U.S. EPA’s AP-42 guidance also identifies NOx emissions as a major operating concern. Small details matter. Catalyst condition matters.

Service quality separates capable suppliers from merely large producers. Strong offers may include tank-farm planning, rail or bulk-truck coordination, remote process monitoring, catalyst management, emergency response, and technical support during concentration changes. Lifecycle data should include delivery reliability, plant uptime, emissions performance, and corrective-action records. Some suppliers still present impressive capacity figures without showing independent evidence. That weakness deserves scrutiny. A practical assessment combines audited quality systems, recent performance data, local storage capability, and clear specifications for every shipment.

Safety Standards, Regulations, and Global Supply Chain Factors

Selecting top nitric acid suppliers worldwide requires more than comparing price and concentration. A dependable supplier demonstrates strong safety controls, qualified personnel, and consistent batch documentation. Buyers should request current safety data sheets, certificates of analysis, and evidence of management systems such as ISO 9001 or ISO 14001. Facility audits can reveal practical details, including corrosion-resistant storage tanks, protected loading areas, and clearly marked emergency equipment.

Regulatory compliance must fit every route and destination. Nitric acid shipments may involve dangerous-goods rules for road, rail, sea, or air transport. Requirements differ by concentration, packaging, port, and national authority. Suppliers should provide accurate labels, transport documents, traceability records, and emergency response contacts. Segregated storage is essential because nitric acid can react dangerously with incompatible materials. A clean loading bay matters.

Global supply chains add another layer of risk. A capable supplier maintains reliable production, approved carriers, backup routes, and realistic lead times. Buyers should examine port congestion, seasonal weather, container availability, and local storage capacity before signing a contract. Dual sourcing may improve resilience, but only when both suppliers meet identical technical and safety standards.

No supplier is perfect. Even strong systems can fail during sudden demand or severe weather. I would question vague delivery promises and incomplete incident records. Regular reviews, site inspections, and small trial orders provide stronger evidence than polished sales language. Practical experience still matters.